michiexile on statistics
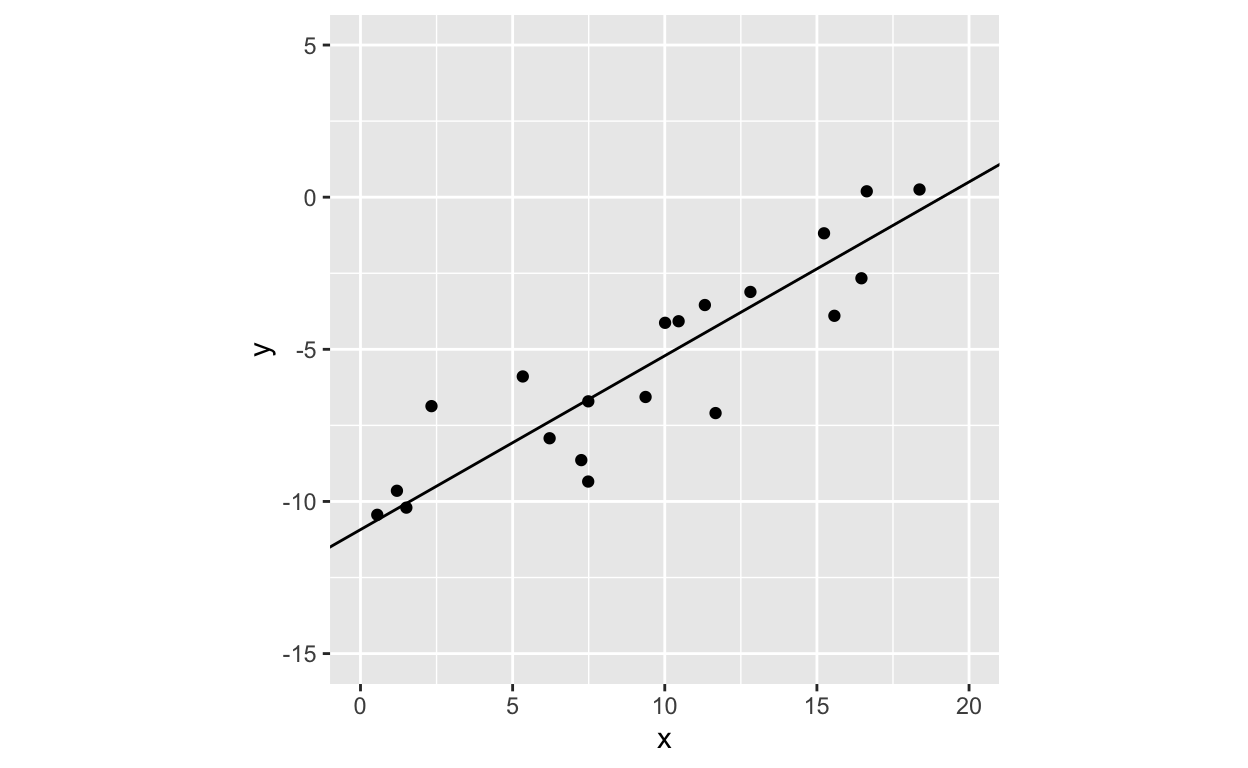
Making an illustration of Orthogonal Regression
It's easy enough to draw a figure illustrating the distances used in the optimization target for an ordinary linear regression. Getting the corresponding illustration right for orthogonal regression took me enough extra work that I wanted to share the resolution.
Errata for Student (1908)
There are arithmetic errors in the paper that created Student's T-test.
Hoeffding's inequality and a Bernoulli confidence interval
Following up on the previous article, we take a closer look at the derivation of the conservative finite sample confidence interval.
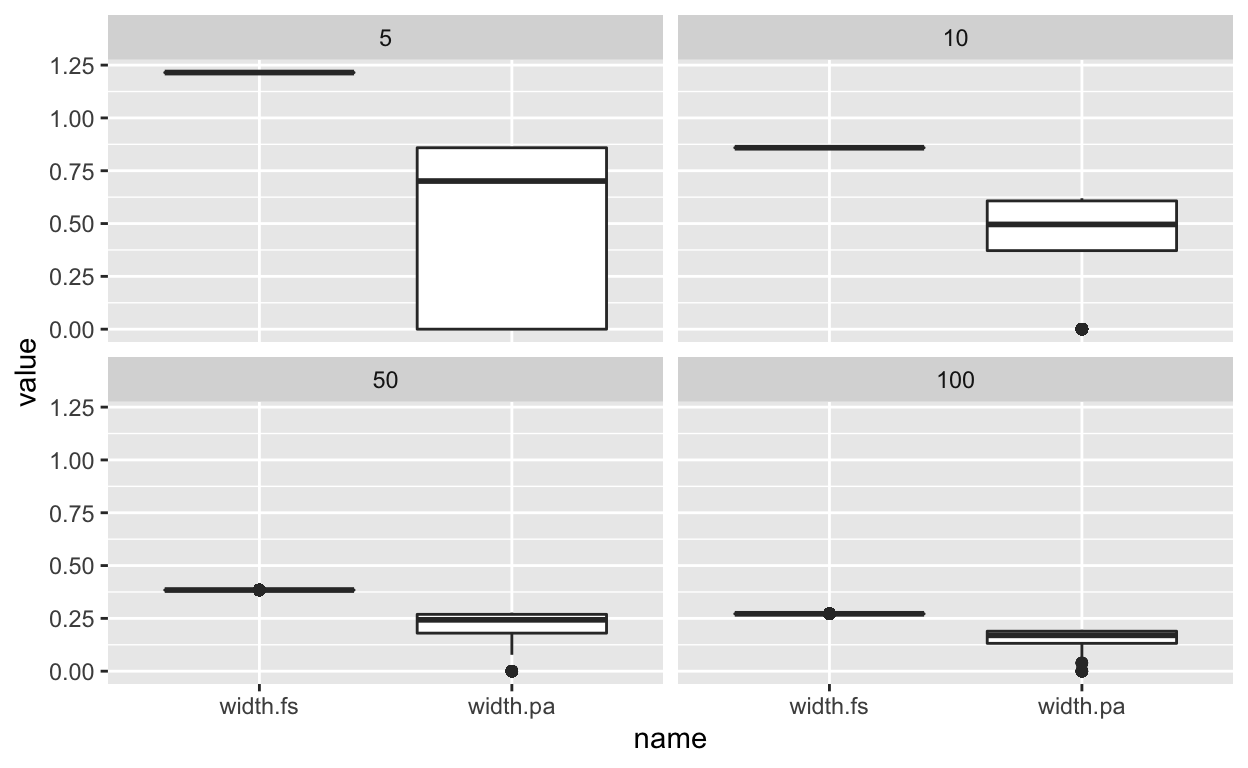
Confidence intervals for Bernoulli samples
Empirical exploration of the sizes of two Bernoulli confidence intervals.

Robustness simulations in R
Repeating robustness tests from John D Cook's blog, but with R code instead of Python.

The Bootstrap
A description of the Bootstrap, and an example from "All of Statistics"

Mythbusters Navigation
A look at data from Mythbusters 12x5.